|
MARKET HIGHLIGHT, NOVEMBER 2011
BOSTON
Office
In 2011, the Boston commercial real estate market has shown some signs of life, with most movement attributed to small and medium-sized companies. 2012 appears to promise much of the same, with the greatest demand coming from the 5,000- to 25,000-square-foot users who are growing. Meanwhile, larger tenants are still active in the market but taking less space, effectively offsetting what smaller companies are growing into.
The largest users in the Financial District are law offices and financial services firms, and the downsizing in these industries has resulted in increased vacancies. In addition, major businesses have become more efficient users of office space (fewer administrative employees per attorney, more “hoteling,” equal sized offices for all, etc.) and more conservative in growth projections, resulting in less space demand for companies when they do grow.
Over the last 12 to 18 months, Boston’s top commercial real estate markets have shifted. The Back Bay area has started to run away from the Financial District as the preferred submarket in Boston. Its appeal is shared between employers and employees alike, with a “24/7” neighborhood feel, new retail shops and restaurants and easy access from the Pike for commuters. These qualities have helped the Back Bay achieve higher rents and lower vacancy rates that have dropped into the single digits. (While vacancy rates have dropped slightly in the Financial District since last year, they are still hovering around 15 to 17 percent.)
2011 also saw the Seaport District rise in popularity, a trend we expect to see continue in 2012. Similar to the Back Bay, the vitality of Liberty Wharf has created a groundswell of interest in the entire Seaport District. Deals like the Vertex Pharmaceuticals move are also serving as a catalyst in the area. Vertex is leaving Cambridge and building 1.1 million square feet in the Seaport. This is a big transition that will likely attract more development with it. In fact, a law firm recently decided to follow Vertex and leave Cambridge for the Seaport.
Of course, the seasons play a role in Boston’s appeal. During the summer months, the walk across Fort Point Channel is far more bearable than between November and April, giving the Seaport an extra boost of popularity that won’t play as much of a factor when the snow flies.
Current rental rates are trending from the $50s to mid-$70s in the Back Bay. In the B market, it’s closer to $30s and $40s. The better space in the Financial District is paying up to the high $50s, while low-rise spaces in Class A properties in the Financial District are priced from the high $30s to mid-$40s. For B market space in the Financial District, the range is from the high $20s to low $30s. The Seaport has now been dubbed the “Innovation District” and is commanding $30 to $40 per square foot.
While fundamentals have stabilized, the values established by recent sales are higher than one would expect. If you look at vacancy and rental rates, you have to question whether the current values are in line with the fundamentals. Do the rent growth model and assumptions about the property justify the price? The prices at which these buildings are selling is higher than the fundamentals will tell you they’re worth. For example, TIAA-CREF recently purchased 33 Arch Street for $365.8 million (more than $600 per square foot). 53 State Street is on the market and is expected to command a similarly high price on the heels of the 33 Arch Street deal.
We have come a long way in the last two years, but if the stock market is any indication, we still have a long way to go. During the recent downturn, the industry expected a flood of sublease space that never materialized. This is due to the hard lessons of the boom and bust in the early 2000s that caused many companies to remain conservative with space needs in today’s turbulent economy. Now that the cautious approach has been validated, I expect the conservative growth trend to continue in 2012. Firms that are growing aren’t going overboard, and larger firms that are not growing will give some space back. There will continue to be excess supply, and developer-driven construction projects will remain scarce.
— Garrett Larivee, vice president with Boston-based McCall & Almy.
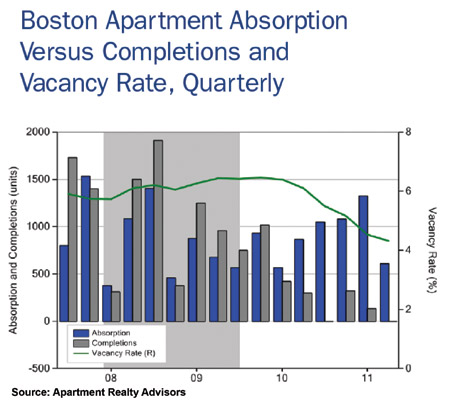
Multifamily
The Boston apartment market is on fire. As a result there is a vast amount of equity, developer interest, and investor interest focused on the Greater Boston Market. What does this mean for the future of the Greater Boston Apartment market?
First a matter of definition, the metro Boston market encompasses all towns within Interstate 495 (Boston’s second beltway) and inwards and, therefore, does not include Central and Western Massachusetts, New Hampshire nor Rhode Island.
The overall vacancy was 4.2 percent in second quarter 2011 (REIS: Metro Boston submarket). Class A property has seen the greatest rent growth, 1.5 percent in Q2 2011, alone. However, Class B property has maintained a lower vacancy at 4.5 percent during Q2 2011, dropping from 5.9 percent.
The city of Boston has exhibited the most rental growth of any submarket of all the Greater Boston submarkets. In the city, rent is up 6.5 percent over the first half of 2011 with rents exceeding $4 per square foot and an average rent of $4,400 per unit based on a recent ARA Class A Survey. These rents are attracting developers and capital. The most recent development start is the 187-unit Avalon Exeter Apartments at the Prudential Center. This start comes after 10 years of permitting. Another recent start, The Victor by Simpson Housings, is 287 units located at Bullfinch Triangle, a former Big Dig site near the TD North Boston Garden. It is just getting underway after at least 6 years of permitting. Closer to Boston Common, The Kensington was just approved for 394 units at the entrance to China Town and the Theater District. Beyond these sites, which have started construction, there are about a dozen other institutional size apartment sites in Boston still in the planning or permitting process for rental housing.
In the suburbs, rents have also grown substantially, with concessions being nominal if any. The burn-off of concession has been substantial from 1 or 2 months’ free rent during 2007 to no free rent and higher rents. Overall, Class A property has seen the greatest rent growth (1.5 percent versus 0.4 percent in Q2 2011 and 3 to 6 percent over the last year’s rents). The market exhibiting the most growth is the Metro West market with 6 percent rent growth in 2010.
The suburbs have a modest amount of development anticipated for the rest of 2011 and 2012. The most active town is Stoughton in the Route 128 South market with several projects that are under construction or recently completed, including Hanover’s 240-unit The Lodge at Stoughton and Woods Partners’ Indian Woods. The Metro West market has one large project totaling 407 units. This project, Chrysler Apartments, is across from the Natick Mall. Avalon Bay just purchased the development rights for this project from Forest Properties.
We should watch the timing and impact of new developments hitting the market in Boston. In the meantime, we expect strong rent growth for at least 2 to 3 more years as a result of new job creation, an increased preference for renting, and lack of new supply. Rent in the city of Boston will continue to grow with the increase in the cohorts 20- to 35-year-olds and empty nesters who have a preference for urban rentals flowing in from the suburbs.
— Richard Robinson, principal with the Boston office of Apartment Realty Advisors.
Suburban Boston Industrial
Despite an economic recovery that is characterized on a national level as listless and lacking vitality, a rising national unemployment rate and apparent challenges in distancing ourselves from the debt crisis, the commercial real estate market in Massachusetts has begun to pick up steam as we approach the end of the year. Market indicators for the Greater Boston market continue to improve, albeit slowly, especially in the high growth sectors such as the pharmaceutical and biotechnology industries.
Employment in the Boston Metropolitan Statistical Area (MSA) grew by 2.1 percent in the 12 months from August 2010 to August 2011. New jobs dropped unemployment to 6.4 percent from 7.5 percent a year earlier, compared with Massachusetts’ unemployment of 7 percent and the national unemployment of 9.1 percent as of August 2011. The leading non-farm payroll jobs in the Boston MSA are education and health services, trade transportation and utilities and professional and business services, according to the U.S. Department of Labor’s Bureau of Labor Statistics.
The overall Boston industrial market ended mid-year 2011 with a vacancy rate of 11.2 percent. The vacancy rate was down from earlier in the year with net absorption equating to positive 1.72 million square feet in the quarter. From mid-2010 to mid-2011, net absorption of industrial space was positive by 2.66 million square feet. The vacancy factor was slightly higher for flex space, at 14.2 percent.
The amount of vacant sublease space in the Boston market decreased to 2.44 million square feet by the end of the second quarter 2011, from 2.52 million square feet at the end of the first quarter 2011. The largest lease signings occurring in 2011 included the 135,000-square-foot lease signed by NFI Industries at 66 Saratoga Blvd. in Devens, the 88,873-square-foot deal signed by VEECO Instruments at 558 Clark Road and the 80,912-square-foot lease signed by MIT Lincoln Laboratory at 3 Forbes Road. The average rental rate for Boston industrial space at mid-year was $6.25 per square foot.
Approximately 366,000 square feet of industrial space was under construction at the end of the second quarter 2011.
Total year-to-date industrial building sales activity in 2011 is up compared to the previous year. In the first three months of 2011, the market saw 34 industrial sales transactions with a total volume of $119.91 million. The price per square foot has averaged $45.77 this year. In the first three months of 2010, the market posted 33 transactions with a total volume of $96 million. The price per square foot averaged $27.61. One of the largest transactions that occurred within the last four quarters in Boston market is the sale of 55 Lyman Street in Northborough. This 260,760-square-foot industrial building sold in January for $18.3 million, or $70.18 per square foot.
Individuals involved in the commercial real estate market in the Boston area have a myriad of reasons to be optimistic. Sales activity has increased, the vacancy rate has declined and many companies are poised to grow. The suburban Boston area offers several salient and compelling advantages in comparison to other areas of the country. The region’s vast number of high caliber institutions of higher learning, rich and diverse cultural heritage, dramatic change of seasons and scenery, outstanding professional sports teams, established biotech and pharmaceutical, along with financial and manufacturing sectors combine to act as a magnet for new talent and entrepreneurial start-ups. While the national picture continues to look bleak in many ways, the commercial real estate world in suburban Boston is beginning to improve significantly.
Looking ahead, we expect vacancy rates for Boston industrial space to compress further with the potential of reaching single digits a year from now, while rental rates should hold steady for several months and then begin to inch upwards by mid-year 2012.
— David Stubblebine, president of Lexington, Massachusetts-based The Stubblebine Company/CORFAC International
Retail
Operations will remain tight in the urban core as retailers expand to premier locations in Boston, while stagnant building activity and an uptick in demand will allow operators to backfill under-utilized space in the suburbs. As businesses expand payrolls in the Financial District, residents will migrate toward major employment hubs and entertainment districts in surrounding areas. As a result, global and national retailers will expand or relocate from older centers in peripheral neighborhoods to newer, redeveloped infill properties in Boston. Prime shopping districts in Back Bay, including Newbury Street, Commonwealth Avenue, and Boylston Street will garner the most consideration this year as tenants lease quality, street-level store fronts with high visibility. As available space shrinks in the submarket, vacancy will drop to a metrowide best of 3.4 percent this year, giving owners enough leverage to raise rents. Meanwhile, muted construction and large lease signings will support positive net absorption in third-ring suburbs such as Bristol County and Merrimac Valley submarkets, reducing vacancy an average of 100 basis points this year.
Solid retail sales and job growth encouraged tenants to move forward with expansions, underpinning a 60-basis-
point decrease in vacancy over the past year to 6.5 percent. In the prior 12 months, supply-side pressures drove vacancy up 30 basis points. Positive net absorption of 120,000 square feet was logged in the metro’s neighborhood/community center sector over the past year, pulling down the average vacancy rate 30 basis points to 6.7 percent. In the previous year, vacancy remained flat. Leasing activity for newer power centers outperformed all asset classes in the past year, as muted construction activity supported positive net absorption of 170,700 square feet, reducing vacancy 120 basis points to 4.9 percent. Builders will deliver the least amount of new space on record this year, combining with solid demand to push down vacancy 40 basis points in 2011 to 6.1 percent.
A sharp upswing in tenant demand prompted owners to raise asking rents 0.5 percent in the past year to $21.11 per square foot, the first year-over-year increase since 2008. Effective rents followed the same trend, ticking up 0.5 percent in that time to $18.88 per square foot. Despite the improvement in rental rates, concessions remained near peak levels in the second quarter at 10.6 percent of asking rents. By year’s end, asking rents will rise 1.3 percent to $21.35 per square foot, while effective rents will climb 2.2 percent to $19.26 per square foot. In the prior 12 months, asking rents ebbed down 0.1 percent, and effective rents retreated 0.8 percent
As the local economy recovers at a brisk pace, institutional capital will flood the metro as investors look for long-term stability and passive income. In a flight to safety, REITs and foreign investors will acquire single-
tenant properties net leased to a national chain for long-term revenue streams and capital preservation. These risk-averse buyers will take advantage of the low interest rates and expand their portfolios in premium locations inside of Route 128. As bidding intensifies, first-year returns will slightly compress in the second half, averaging in the high-6-percent-to-low-7-percent range. In the multi-tenant arena, sales velocity will modestly pick up as local investors target strip centers with mom-and-pop tenants in Middlesex and Norfolk counties for higher potential upside. Performing shopping centers with a strong grocery anchor will command yields in the low-to-mid-7-percent range, while unanchored, in-line space will trade above 8 percent.
— Robert Horvath and Todd Tremblay are senior associates in the Boston office of Marcus & Millichap Real Estate Investment Services
©2011 France Publications, Inc. Duplication
or reproduction of this article not permitted without authorization
from France Publications, Inc. For information on reprints
of this article contact Barbara
Sherer at (630) 554-6054.
|