|
COVER STORY, JANUARY/FEBRUARY 2010
LOW RENT, NO RENT AND TI PACKAGES, TOO
Landlords in markets with high vacancy rates are offering very attractive packages to new and renewing tenants.
By Jaime Lackey
Fourteen months’ free rent in a Manhattan office building. Industrial rents down 20 percent in the greater Boston area. These numbers may not be the average for concessions available, but they are representative of the measures some landlords are taking to fill space in the current economy.
Northeast Real Estate Business recently spoke with Grubb & Ellis brokers about the markets that are adjusting to increasing vacancy rates. Michael Gottlieb, executive managing director with the Manhattan office; Wayne Fisher, executive vice president with the Philadelphia office; and Anne Klein, senior vice president with the Marlton, New Jersey, office, discuss their respective office markets. Benjamin Shapiro, executive vice president with the Edison, New Jersey, office; Bradford Spencer, senior vice president with the Boston office; and Steve Bonge, senior vice president of Grubb & Ellis’ Global Logistics Group in the company’s King of Prussia, Pennsylvania, office, discuss their respective industrial markets.
“I’ve never seen anything like this [economy],” says Shapiro, who has worked in commercial real estate for 25 years. He predicts foreclosures and distressed assets will continue to put pressure on pricing.
Even as occupancy rates improve and the economy begins to recover, the financial viability of building owners may affect the recovery in pricing, Gottlieb says. “There is approximately $1 trillion of commercial loans maturing nationally that will continue to change the market landscape over the next 2 to 3 years. In the past, owners looked to measure the credit-worthiness of tenants, and although this will still occur, many tenants are equally concerned about the credit-worthiness of landlords. We are already seeing tenants become more diligent in researching an owner’s ability to fund building improvements, tenant work allowances and provide ongoing building services as part of their leasing decision.” (He notes that in the first three quarters of 2009, $5.1 billion in distressed loans were identified across all commercial properties in Manhattan alone.)
Fisher adds, “It’s a story of the ‘haves’ and ‘have-nots.’ For example, REITs aren’t typically capital-constrained, so they have the money to do deals. The ‘have-nots’ are talking to lenders and investors — doing whatever they can to keep making transactions. In Philadelphia, landlords have historically been willing to put capital towards doing deals, so the ‘have-nots’ are in a weak position.”
Office Markets
According to Klein, “Landlords that are desperate are trying to buy deals with whatever it takes. They may require less credit, offer higher tenant improvement allowances (if they have the cash) and allow for shorter lease terms than they would normally accept.”
“[In Southern New Jersey], we’re seeing lots of free rent,” Klein adds. “We also see some moving allowances, but mostly it’s free rent. Landlords are trying to avoid spending too much money on tenant improvement allowances if they can. Offering free rent instead helps maintain higher face rental rates and requires less cash up front.”
According to Fisher, “Tenants [in Philadelphia] are looking to accomplish zero-capital transactions. They want to minimize the amount of their own resources put into a transaction, so they look for landlords to include a blend of capital for their build-out and free rent.”
He adds that big corporations and large law firms tend to favor renewal over a large new transaction where it would cost more than $100 per square foot to move. Smaller firms are taking advantage of moving allowances, tenant improvement monies and concessions from landlords to make a move worthwhile. These transactions typically fall in the $50- to $75-per-square-foot range.

Manhattan
In Manhattan, the most generous landlord concession packages have offered upwards of 15 months of free rent and more than $100 per square foot in tenant improvement allowances, Gottlieb says. “Although these aggressive concessions are not the norm, some landlords are willing to do whatever necessary to stabilize their building’s cash flow by ensuring occupancy through the current down cycle.”
In Manhattan, concessions on a 10-year office deal averaged $60 in work allowances and 6 months of free rent in 2009.
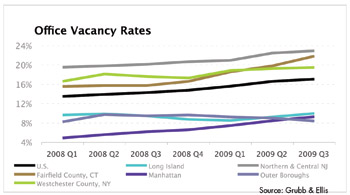
Gottlieb notes that Manhattan has more than 53 million square feet of available space. This is the largest amount of available space in the Manhattan office market since the early 1990s. At the end of 2009, Manhattan’s available supply was larger than the total size of every central business district around the country excluding only Chicago, Washington, D.C. Metro, and Boston.
Midtown Manhattan has the highest ‘vacancy rate’ in Manhattan at 9.9 percent. However, when occupied space being marketed for lease is included in the statistics, the Midtown ‘availability rate’ is significantly higher at 15 percent. Average asking rents for direct Class A space in Midtown were just below $67 per square foot at the end of 2009; net effective rents were substantially lower, at just over $50 per square foot. Overall, in Manhattan, net effective rents are more than 50 percent lower than they were 1 year ago.
Philadelphia CBD
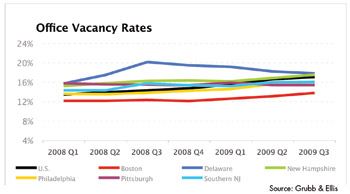
“At the end of fourth quarter 2008, Philadelphia was still registering positive absorption,” Fisher says. “There was no new construction at that point, and none was planned. Philadelphia followed the nation into the recession, but the fact that we had low vacancy entering the recession with no new construction put us in a good position.”
However, he continues, “the vacancy rate has jumped about 300 basis points, and we’ve seen about 1 million square feet of negative net absorption. Landlords who were bullish at the end of 2008 began making whatever deals they needed to make by the middle of 2009.”
Markets with predominantly Class B and C office product — including Chestnut Street, Broad Street and Independence Square — are seeing tenants vacate space in favor of Class A office space where rents are in their price range for the first time in years. Fisher predicts these markets will weaken over the next 12 to 18 months, while submarkets rich in Class A space — like West Market — will see improvement.
Southern New Jersey
According to Klein, the Southern New Jersey office market — including Burlington, Camden and Gloucester counties — is small but steady. “We don’t have a lot of peaks, but we also don’t have a lot of valleys. We tend to be pretty consistent. Right now, the Southern New Jersey office market is holding its own in light of the economy. Our vacancy is less than the national average, and although rental rates have declined a bit, I think the worst is over.”
The highest vacancy rates can be found in the Camden/Pennsauken area and the Cherry Hill submarket. According to Klein, Marlton and Moorestown, tend to be more active markets because they offer newer buildings and have better access to the main Northeast corridor arteries. Marlton and Moorestown also have access to more residential areas and thus a greater labor pool.

Industrial
Industrial markets are also seeing free rent, moving allowances and extensive tenant improvement packages.
Early renegotiations are also common, Spencer says. “Landlords and management companies are meeting with tenants early and trying to renegotiate leases before they come due; tenants and landlords are trying to avoid transaction and relocation costs.”
Spencer says some industrial landlords in the greater Boston area are offering face rents that are 20 percent less than past market value.
“Landlords are being very aggressive in an attempt to fill their buildings,” Shapiro agrees. He cites an example in the Exit 8A submarket in New Jersey, where a 230,000-square-foot 10-year deal included a year of free rent in addition to a low face rate.

Northeastern Pennsylvania
The Northeastern Pennsylvania logistics market — essentially the I-88 corridor — has been slow and sporadic, Bonge says. “We’re coming off several years of robust speculative development, and that has caused vacancy in Class A and B logistics space to creep up to the 18 to 19 percent range. We have seen some positive absorption in the region, but it’s been nowhere near the levels of the past few years. Build-to-suit activity was considerably less in 2009 than in the past 3 years, and speculative development has completely ceased.”
The Hazelton/Wilkes-Barre/Scranton submarket, which has seen a lot of speculative development in recent years, has the highest vacancy rate in the area. “We haven’t seen a lot of companies give up space — in fact, we’ve seen positive absorption,” Bonge says. “So it remains a strong market, the positive absorption just hasn’t been enough to offset new construction deliveries.”
Graham Packaging took 170,000 square feet in Hazelton; Electrolux took 455,000 square feet in Pottsville; Diapers.com closed a deal in Covington Industrial Park that was 400,000 square feet and will expand to 800,000; and The Home Depot completed a build-to-suit for about 450,000 square feet in Pittston. “With the exception of The Home Depot transaction, which is a new facility for the company, many of the deals we’re seeing are relocations. Companies are looking for better efficiency and better value. This is a great time for companies who can relocate to do so — there is a lot of great Class A space on the market at rates lower than we’ve seen in recent years.”
Greater Boston
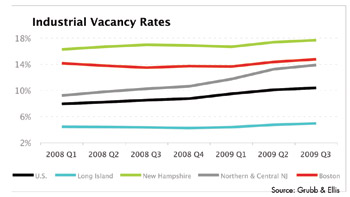
The Greater Boston suburban industrial market contains approximately 200 million square feet and has a 15 percent overall vacancy rate.
“At present, the market can be characterized as weak at best with little demand and soft rents,” Spencer says. “The fact that the market is a mature one that lacks a major port are two factors which will continue to inhibit growth and impair prospects for a substantial turn around in 2010.”
Currently the Route 3 North R&D/flex market and South 495 “big box” market have the highest vacancy rates in their respective categories. The Route 3 North R&D/flex market has never fully recovered from the 2000 tech bust, and the South 495 “big box” market has been affected by major consumer-oriented firms moving away from a regional warehousing model and towards one based on a more centralized distribution model.
“While 2009 has been a difficult year for the region, we have seen a diverse group of deals across the business spectrum,” Spencer says. “World class Fortune 500 life science, home electronics, logistics and telecommunications firms have all been active in this market over the past 12 months.”
Northern and Central New Jersey
“Overall, the market has been slow,” Shapiro says, “but there have been some deals done lately, leading me to believe that things are starting to bottom out.”
A local electronics chain purchased a 324,000-square-foot former Toys ’R Us distribution facility in Somerset. Arizona Iced Tea purchased a building in Edison. “Both are major moves in a market where financing is very difficult,” Shapiro says, “but both of these deals closed in the low $40-per-square-foot range. Not long ago, these buildings in Central New Jersey would have sold in the $60- to $70-per-square-foot range.”
There also continues to be data center growth on the 287 Corridor. A developer recently purchased the former 229,000-square-foot Drug Fair headquarters and distribution facility to carve up for small data center requirements. Digital Realty Trust and Dupont Fabros also have large speculative data center facilities in this market.
The 8A submarket is experiencing challenges, including a vacancy rate of 21.7 percent.
Shapiro says, “As a central location in proximity to Manhattan, Boston, Philadelphia and Washington, D.C., the area evolved over time to become a popular market for big-box warehouses. The 8A submarket, which contains 59.8 million square feet of inventory, became overbuilt because it garnered a worldwide reputation for its location, which brought on a flood of new development. In addition, demand has decreased as 8A has had to face competition from other markets throughout the Northeast.”
He continues, “Some deals are getting done in the 8A market but at deeply discounted rates. Williams-Sonoma’s 1.4 million-square-foot lease in what is known as the IDI building is an important transaction, not only because this brand new building has been sitting vacant for 3 years, but also because it represents an expansion doubling the size of the company’s previous facility that is located in the 8A submarket. We are starting to see other deals in that market as well, with companies taking advantage of extremely low lease rates on Class A space.”
Looking to the Future
Job growth is obviously key to improvement in office markets. However, Fisher doesn’t expect to see significant improvement in Philadelphia’s office market until 2011. He explains, “Job growth is not going to happen until late this year, so I don’t think we’re going to see improvement in the [office] market until 2011 or later. Also, we’ve got phantom vacancy — companies will need to fill existing unoccupied space before expanding into new space.”
Through September 2009, year-over-year New York City office sector job losses totaled 75,000 jobs. According to Gottlieb, more job losses are expected to occur in 2010, tapering off by year-end, and leading into a jobless recovery in 2011. Both Moody’s Economy.com and the New York City Department of Budget and Management predict that job creation will begin in 2012. Gottlieb says, “Only when job creation resumes will the market begin to absorb the decade-high inventory of available space.”
Industrial market improvement will require better employment numbers, increased consumer spending and lender confidence, Spencer says. He expects to see improvements in industrial markets by the fourth quarter 2010.

©2010 France Publications, Inc. Duplication
or reproduction of this article not permitted without authorization
from France Publications, Inc. For information on reprints
of this article contact Barbara
Sherer at (630) 554-6054.
|
